
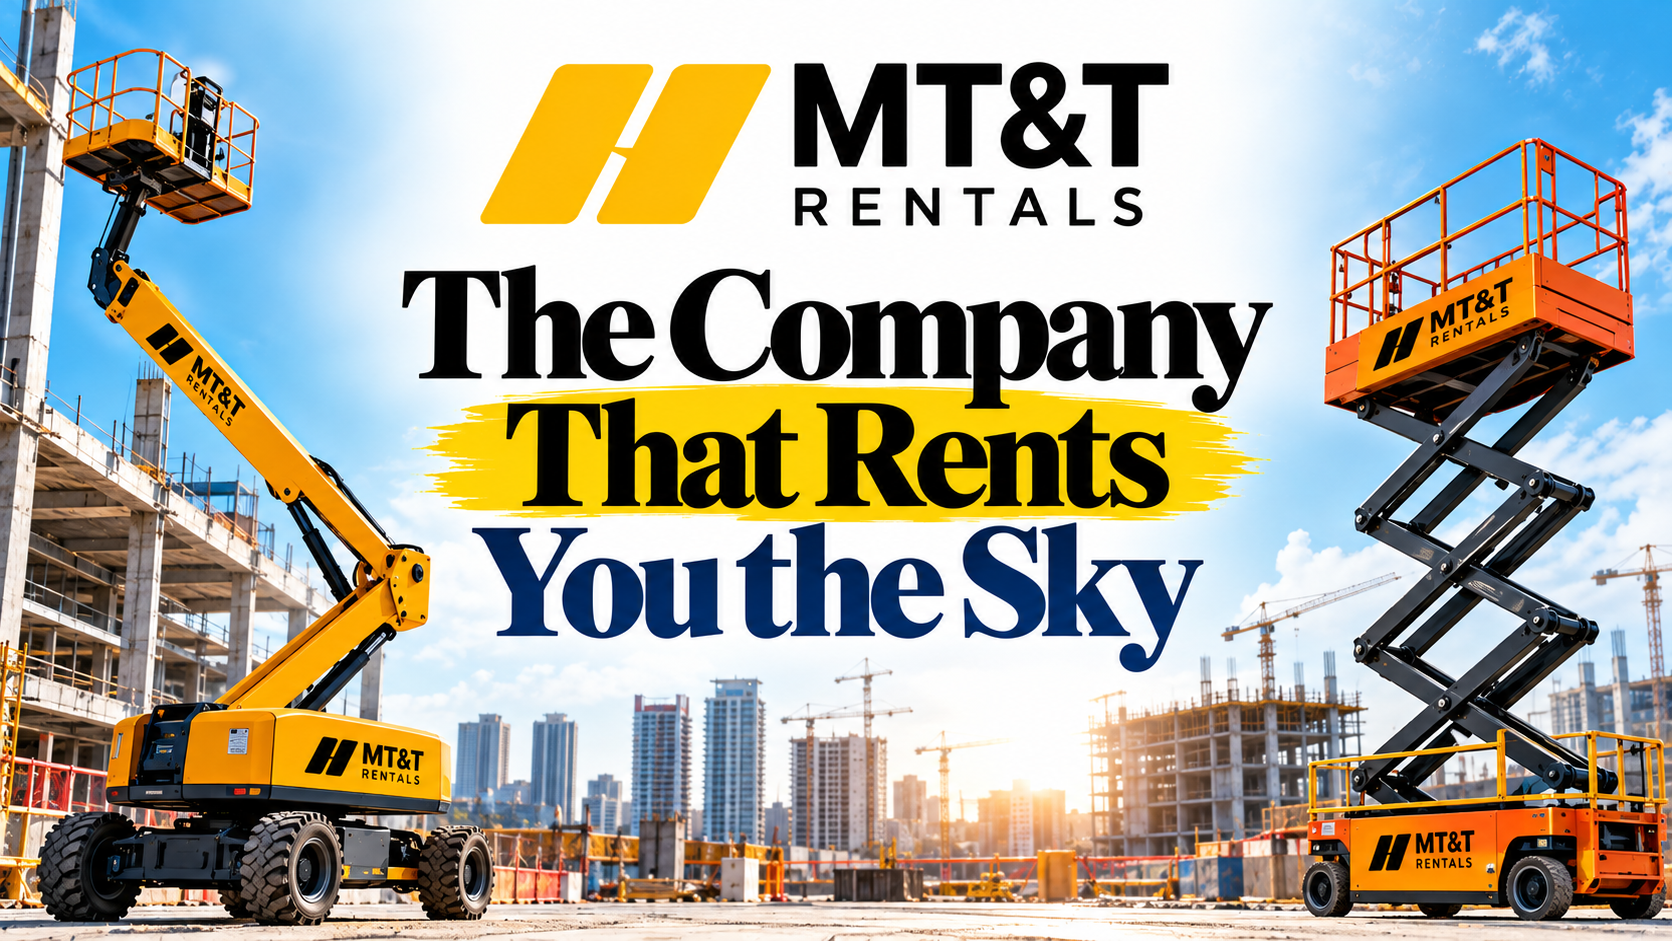


MTandT Rentals: Navigating Growth in India’s Expanding Aerial Work Platform Market
India’s industrial and infrastructure boom faces a significant disparity in critical equipment: the nation possesses only approximately 20,000 Mobile Elevating Work Platforms (MEWPs), starkly contrasting with the hundreds of thousands deployed in the United States and China. MTandT Rentals aims to bridge this immense gap, demonstrating robust financial performance with 63% revenue growth and 73% profit growth in FY26. However, challenges such as protracted collection cycles and negative free cash flow suggest a more complex operational reality. This analysis delves into MTandT’s business model, its current valuation at ₹545 per share, and the broader industry insights gleaned from global giant United Rentals.
MTandT Rentals: Elevating India’s Construction Landscape into a ₹974 Crore Enterprise
Consider a modern construction site, perhaps a warehouse under development along the Yamuna Expressway. A 40-foot ceiling requires an electrician to install lighting. Two decades ago, this task would have necessitated precarious bamboo scaffolding. Today, a MEWP provides a safe, efficient solution, elevating the worker smoothly to the required height. Such equipment is often not purchased by contractors but rented from specialized providers like MTandT Rentals.
A) Evolution and Scale
MTandT Rentals commenced operations in Chennai in 2009 with a straightforward premise: large, specialized lifting equipment is expensive, and most projects require it for finite periods. Establishing a fleet for rental offered a scalable solution. Seventeen years later, the company’s footprint includes:
- A fleet valued at approximately ₹585 Cr (cost basis), predominantly imported scissor and boom lifts.
- Strategic yards located across India: Chennai, Noida, Jewar, Mumbai, Ahmedabad, Bengaluru, and Bhubaneswar.
- A workforce of 1,230 employees.
- ₹120 Cr in capital raised this year from investors, including ValueQuest.
FY26 marked a pivotal year for accelerated growth.
B) Revenue Streams and Operational Model
MTandT operates a multifaceted business model, akin to a heavy machinery rental company with integrated sales capabilities. Its revenue generation is driven by three primary engines:
- Equipment Rental: The core business involves leasing MEWPs to project sites. Billing is based on monthly log sheets detailing machine usage, providing a stable, recurring revenue stream.
- Equipment Trading: Catering to clients preferring ownership, MTandT sells new equipment, ground-protection mats (Porta Deck), and spare parts. This segment, while more volatile, has experienced rapid growth.
- Used Fleet Recycling: After several years in the rental fleet, machines are sold. Due to accelerated depreciation on the books, these sales frequently yield profits, which are recorded as gains over book value.
Segment Performance (Standalone, ₹ Cr)
| Engine | FY26 | FY25 | Growth |
|---|---|---|---|
| Rental | 169.07 | 118.78 | +42% |
| Equipment Sales | 163.69 | 89.27 | +83% |
| Mats, Spares & Others | 25.93 | 9.29 | +179% |
| Revenue from Operations | 358.69 | 217.35 | +65% |
| Profit on Used-Fleet Sales | 15.19 | 6.49 | +134% |
Significantly, trading (equipment sales, mats, and spares combined) surpassed rental income in FY26, indicating MTandT’s evolving role as both a rental provider and a prominent equipment dealer.
C) Capital Intensity: The Growth Imperative
Rental businesses are inherently capital-intensive. Growth necessitates continuous investment in new machinery, which is typically financed through bank loans secured by the equipment itself. These assets must then generate sufficient rental income to cover financing costs and depreciation. In FY26:
- ₹250 Cr was invested in new equipment.
- Approximately ₹142 Cr in fresh borrowings was added.
- Depreciation and interest expenses collectively absorbed roughly a quarter of the total revenue.
This operational dynamic creates a growth treadmill: faster expansion demands accelerated capital expenditure. With rental income growing 42% against a 46% increase in fleet size, much of the revenue growth is attributable to fleet expansion rather than improved pricing power.
D) Consolidated Financial Performance (₹ Cr)
| Metric | FY26 | FY25 | Change |
|---|---|---|---|
| Revenue | 366.67 | 224.45 | +63% |
| Operating EBITDA | 130.66 | 84.91 | +54% |
| EBITDA Margin | 35.6% | 37.8% | ↓ |
| Net Profit | 52.64 | 30.44 | +73% |
| Net Worth | 323.62 | 154.49 | +109% |
| Total Debt | 338.90 | 197.33 | +72% |
| Debt / Equity | 1.05x | 1.28x | ↓ (Improved) |
| Cash from Operations | 50.83 | 19.53 | +160% |
The company has achieved significant profit growth and a reduction in leverage, largely aided by the recent equity infusion.
E) Operational Headwinds and Financial Nuances
Despite robust top-line growth, MTandT faces several operational and financial complexities:
- Slow Collections: Receivables doubled to approximately ₹189 Cr, equivalent to six months of revenue awaiting collection. A provision of ₹5.7 Cr has been made for doubtful accounts.
- Negative Free Cash Flow: The company reported a free cash flow of –₹166 Cr, indicating that growth is currently financed by external lenders and investors rather than internally generated cash.
- One-Off Profit Contribution: Approximately 22% of pre-tax profit originated from the sale of used machinery, a non-recurring operational element.
- Foreign Currency Exposure: Roughly ₹270 Cr of payables are denominated in foreign currency, resulting in a ₹3.8 Cr forex loss in the current fiscal year.
- Related-Party Transactions: Notable transactions with promoter group companies exist, including a ₹26 Cr royalty deposit with Mtandt Limited.
F) Valuation Snapshot
While unlisted, MTandT shares trade on platforms like GAGA SHAREat approximately ₹545. Key valuation metrics are as follows:
| Metric | Value |
|---|---|
| Market Cap | ₹974 Cr |
| Enterprise Value | ₹1,240 Cr |
| P/E | 18.5x |
| P/B | 3.0x |
| EV / EBITDA | 9.5x |
| ROE (Average Equity) | 22% |
| Last Funding Round | ₹459/share (≈ ₹820 Cr valuation) |
Current market trading represents a ~19% premium over institutional investors’ entry price six months prior. Notably, the stock is currently at its 52-week low, down from ₹660. An additional risk factor involves preference shares issued this year, which could convert into further equity, diluting existing shareholders if performance targets are not met.
G) Industry Tailwinds and Market Potential
The Indian MEWP rental sector benefits from powerful macro trends:
- Infrastructure Boom: Unprecedented construction activity across metros, airports, factories, data centers, and large warehouses generates significant demand for work-at-height solutions.
- Rising Safety Standards: Global companies operating in India are enforcing international safety protocols, rendering traditional bamboo scaffolding unacceptable. Industry associations like IPAF attribute India’s projected 2025 growth to increasing workplace safety awareness.
- Efficiency and Speed: MEWPs offer rapid deployment and operation, a critical advantage over multi-day scaffolding construction, especially with rising labor costs and tighter project deadlines.
- Economic Advantage of Rental: Renting allows contractors to conserve capital for core project investments, as MEWPs are typically required for finite periods rather than long-term ownership.
These factors are reflected in market growth: India’s MEWP rental market expanded by 32% in 2024 (on a 24% larger fleet) and an additional 18% in 2025 (with a 14% fleet increase and higher utilization).
Global MEWP Fleet Comparison (Approximate Units)
| Country | MEWPs (Approx.) |
|---|---|
| USA (Rental Fleet, 2025) | ~875,000 |
| China (2022) | ~500,000 |
| India (Industry Estimate) | ~20,000 |
The US rental fleet alone reached 875,000 units by 2025, while China experienced a dramatic surge from 40,000 units in 2017 to nearly 500,000 by 2022. India’s significant lag is attributable to four key factors:
- Cost Disparity: Historically, manual labor and bamboo scaffolding offered a cheaper alternative, a gap that is rapidly diminishing.
- Enforcement of Safety Regulations: Unlike the US and Europe, where inadequate equipment for height work can halt construction, enforcement in India is only recently gaining traction.
- Domestic Manufacturing Gap: China developed a robust local manufacturing base, lowering machine costs. India’s reliance on imports leads to higher prices and currency risk (evidenced by MTandT’s foreign-currency payables).
- Operator Dependence: In India, aerial platforms are typically supplied with an operator, increasing costs and hindering rapid fleet scalability.
This substantial gap represents a vast opportunity. Even reaching a fraction of China’s fleet size would require a multi-fold expansion of India’s current MEWP inventory. However, China’s experience also serves as a cautionary tale: rapid oversupply in 2025 led to leading rental companies shrinking fleets and halting new purchases, underscoring the need for disciplined growth in India.
H) Global Benchmark: United Rentals
United Rentals (NYSE: URI), established in 1997, stands as the world’s largest equipment rental company and offers a glimpse into the industry’s long-term potential. With $16.1 billion in revenue in 2025, URI’s scale is approximately 400 times that of MTandT, and its market capitalization is roughly $68.6 billion (₹6 lakh crore).
United Rentals Revenue Growth (US$ Bn)
| Year | Revenue | Growth |
|---|---|---|
| 2025 | 16.10 | +5% |
| 2024 | 15.35 | +7% |
| 2023 | 14.33 | +23% |
| 2022 | 11.64 | — |
The significant revenue jump in 2023 was largely due to the acquisition of Ahern Rentals. Organic growth for URI is currently in the mid-single digits, with a 2026 revenue outlook of $17.5–17.8 billion, implying 9–10% growth.
Comparative Metrics: United Rentals vs. MTandT
| Metric | United Rentals | MTandT |
|---|---|---|
| Revenue Growth (Latest Year) | ~5% | ~63% |
| EBITDA Margin | ~46% | ~36% |
| P/E | ~26x | 18.5x |
| EV / EBITDA | ~10x | 9.5x | Free Cash Flow | +$2.2 Bn | –₹166 Cr |
Intriguingly, MTandT trades at a comparable EV/EBITDA multiple to United Rentals, despite growing over ten times faster. From this perspective, MTandT appears undervalued. However, URI commands its multiple through demonstrated cash generation: in 2025, its operating cash flow rose 14% to $5.19 billion, free cash flow reached $2.18 billion, and $2.36 billion was returned to shareholders via buybacks and dividends. MTandT, conversely, remains in a cash-burning growth phase. While US investors value a proven cash-generating machine, Indian investors are presently investing in a company still under construction. Should MTandT successfully translate its rapid growth into positive free cash flow and improved collections, its valuation gap relative to URI could narrow favorably.
The Bottom Line
MTandT Rentals is positioned to capitalize on India’s burgeoning construction sector, driven by unprecedented infrastructure development and tightening safety regulations. With India’s MEWP fleet representing a fraction of that in the US and China, the growth runway is extensive. MTandT aims to be a leading provider, with management targeting 25%+ annual growth for the next decade.
A valuation of approximately 18.5x earnings is not exorbitant for such growth potential, and on an EV/EBITDA basis, it aligns with United Rentals, a significantly slower-growing entity. Nevertheless, the business is inherently capital-intensive, characterized by slow collection cycles, negative free cash flow, and a long-term exit strategy contingent on a future IPO.
In essence, MTandT’s operational trajectory is upward. Whether investors’ returns ascend in tandem will depend critically on improvements in collection efficiency, free cash flow generation, and the successful execution of an eventual IPO.
Key Metrics to Monitor: FY27 receivables, the outcome of the Compulsorily Convertible Preference Shares (CCPS) conversion, and any forthcoming IPO announcements.
Sources: This analysis is not investment advice. Unlisted shares are illiquid and carry inherent risks; conduct thorough due diligence. US valuation figures are approximate as of early October 2026 and subject to daily fluctuations. India’s fleet size is an industry estimate.
Latest Price : https://mrgaga.in/unlisted-share