
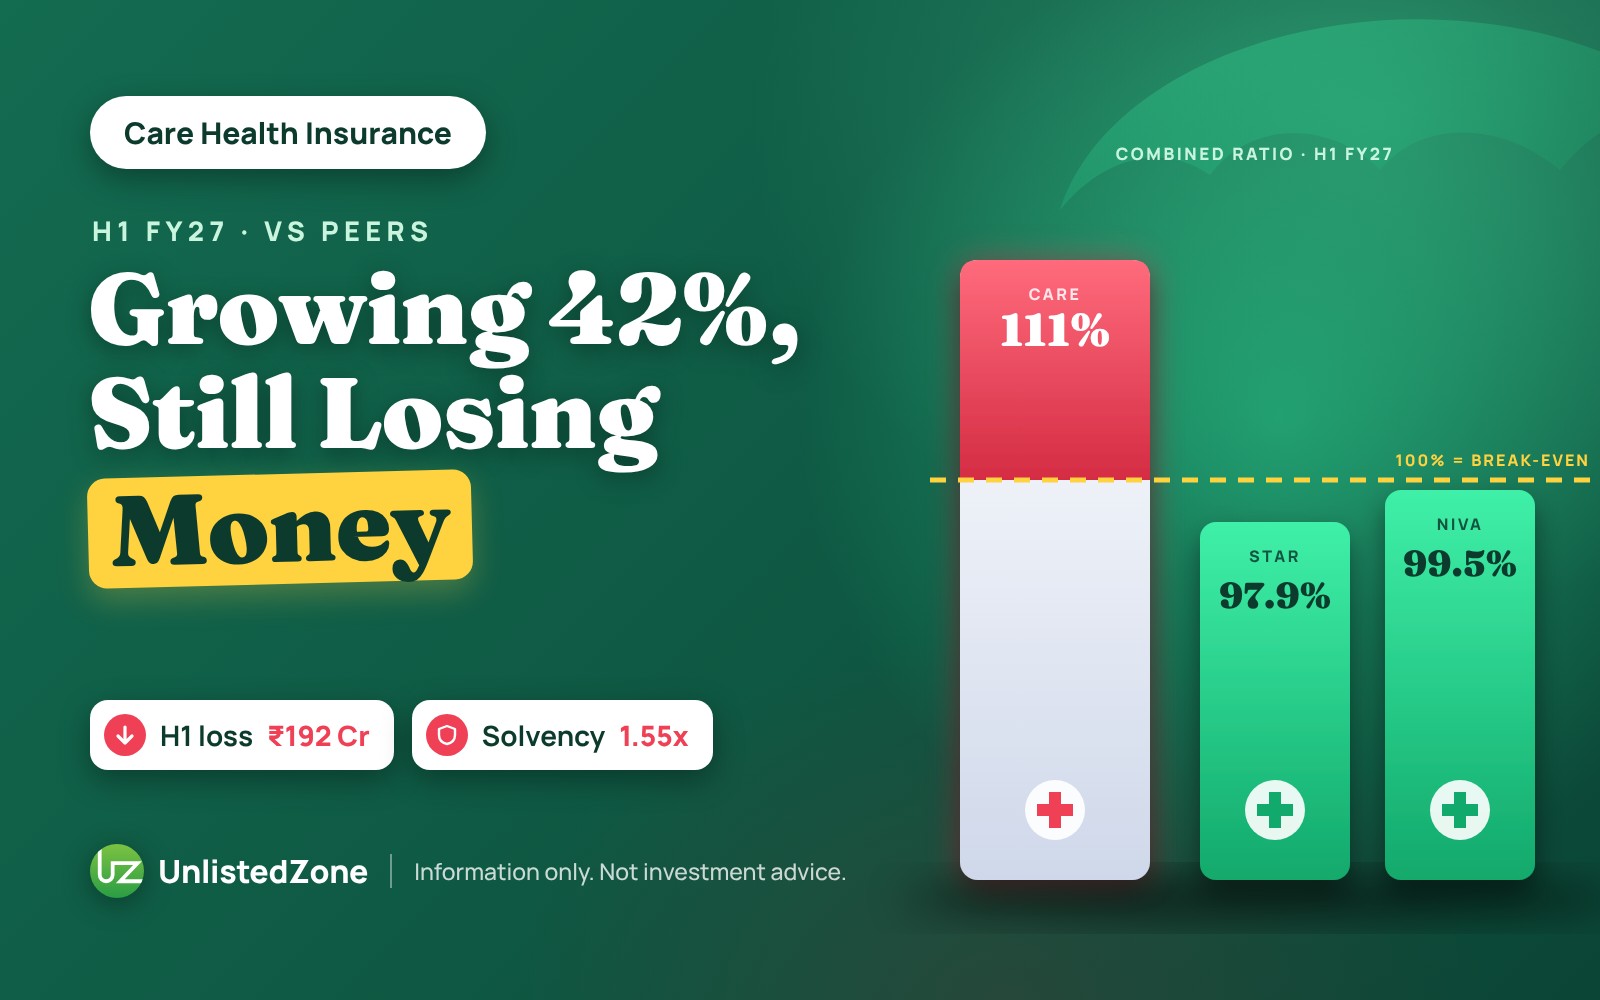


Care Health Insurance Reports ₹192 Crore Loss Despite 42% Premium Growth in H1 FY27
Care Health Insurance experienced a 42% surge in gross written premium (GWP) during the first half of FY27, reaching ₹6,193 crore. However, this robust top-line growth paradoxically coincided with a reported net loss of ₹192 crore, a stark contrast to the ₹18 crore profit recorded in the prior year. This analysis delves into the underlying factors contributing to this financial outcome, dissecting premium allocation, benchmarking performance against industry peers Star Health and Niva Bupa, and examining implications for its unlisted share valuation.
During the six-month period from April to September 2026 (H1 FY27), Care Health Insurance witnessed a significant increase in its GWP, escalating from ₹4,354 crore a year ago to ₹6,193 crore. Despite this substantial growth, the company transitioned from a profit to a loss, prompting a closer examination of its financial dynamics.
Understanding the Revenue Stream: Gross Written Premium
Gross Written Premium (GWP) serves as the primary indicator of an insurer’s sales, representing the total value of policies sold within a given period. Care Health Insurance’s GWP trajectory demonstrates consistent and accelerated growth:
| GWP (₹ crore) | FY26 | FY27 | Growth |
|---|---|---|---|
| Q1 (Apr–Jun) | 2,049 | 2,927 | +43% |
| Q2 (Jul–Sep) | 2,305 | 3,266 | +42% |
| First half | 4,354 | 6,193 | +42% |
This represents an additional ₹1,840 crore in premium collected over six months, with both quarters exhibiting similar growth rates, indicating a sustained upward trend.
Premium Utilization: Deconstructing the Cost Structure
Beyond premium collection, the critical aspect of an insurer’s financial health lies in how much of that premium is expended. An insurer’s primary costs comprise three categories:
- Claims: Payments made to policyholders.
- Commission: Fees paid to agents and brokers.
- Operating Expenses: Includes salaries, rent, technology, and advertising.
Care Health Insurance’s cost allocation, expressed in ₹ crore and as a percentage of GWP, is detailed below:
| ₹ crore (% of GWP) | Q1 FY26 | Q2 FY26 | Q1 FY27 | Q2 FY27 |
|---|---|---|---|---|
| GWP | 2,049 | 2,305 | 2,927 | 3,266 |
| Claims | 1,541 (75.2%) | 1,664 (72.2%) | 2,023 (69.1%) | 2,058 (63.0%) |
| Commission | 422 (20.6%) | 507 (22.0%) | 561 (19.2%) | 672 (20.6%) |
| Operating expenses | 272 (13.3%) | 301 (13.1%) | 411 (14.0%) | 430 (13.2%) |
| Sub-Total (before reinsurance) | 2,235 (109.1%) | 2,472 (107.3%) | 2,995 (102.3%) | 3,160 (96.8%) |
| Premium passed to reinsurers | 485 (23.7%) | 662 (28.7%) | 708 (24.2%) | 1,079 (33.0%) |
Notably, the combined percentage of claims, commission, and operating expenses (before reinsurance) decreased from 109% of GWP in H1 FY26 to 97% by Q2 FY27. This improvement is primarily attributable to a reduction in the claims ratio, as commission and operating expenses have remained relatively consistent, collectively consuming 33% to 35% of GWP.
Note: Claims data presented here are gross claims (before reinsurance) and are estimated. Care’s public disclosures typically present claims incurred net of reinsurance, which has been scaled up using its ratio of gross to net claims paid for this analysis.
The Role of Reinsurance in Risk Management
Insurers often transfer a portion of their risk and premium to reinsurers. This share is increasing for Care Health Insurance, which passed on 28.9% of its GWP in H1 FY27, up from 26.3% a year prior. In Q2 FY27 alone, this figure reached 33%.
While reinsurers share claims liabilities, they also pay commission to the primary insurer. After accounting for both, the estimated net cost of reinsurance to Care was approximately ₹252 crore (4% of GWP) in H1 FY27, an increase from about 2% in the previous year. Factoring in this net reinsurance cost, Care’s total estimated outgo for H1 FY27 amounts to roughly ₹6,405 crore, or 103.4% of GWP.
It is important to note that claims derive from policies underwritten over time. A sharp increase in sales (like 42%) can temporarily make current claims appear lower relative to GWP. The long-term sustainability of a low claims percentage will be contingent on future growth moderation.
Comparative Performance: Benchmarking Against Listed Peers
To contextualize Care’s performance, a comparison with two listed pure-play health insurers, Star Health and Niva Bupa, provides valuable insights:
| First half of FY27, ₹ crore (% of GWP) | Care Health | Star Health | Niva Bupa |
|---|---|---|---|
| GWP | 6,193 | 9,562 | 4,634 |
| GWP growth | 42% | 19% | 33% |
| Claims | 4,079 (65.9%) | 6,817 (71.3%) | 2,955 (63.8%) |
| Commission and acquisition cost | 1,233 (19.9%) | 2,302 (24.1%) | 1,371 (29.6%) |
| Operating and other expenses | 841 (13.6%) | 573 (6.0%) | 253 (5.5%) |
| Net cost of reinsurance | 252 (4.1%) | 42 (0.4%) | 84 (1.8%) |
| Total Outgo | 6,405 (103.4%) | 9,734 (101.8%) | 4,662 (100.6%) |
Key observations from this comparison:
- Growth Leadership: Care Health is the fastest-growing among the three, expanding at more than double Star Health’s rate and now approximately two-thirds of its size.
- Cost Structure Divergence: Each insurer exhibits distinct strengths and weaknesses in cost management. Star Health operates with the lowest commission and operating expenses (around 30% of GWP) but incurs the highest claims. Niva Bupa demonstrates the lowest claims ratio but bears the highest customer acquisition costs (around 35%). Care Health occupies an intermediate position, with combined commission and expenses around 33.5%.
- Reinsurance Reliance: Care Health relies most heavily on reinsurance. While its gross outgo (before reinsurance) of 99.4% places it between Star and Niva, its net outgo after reinsurance, at 103.4%, is the highest of the three, though the difference is less than three percentage points. A year prior, all three companies reported total outgoes between 108% and 110%.
Note: The categorization of commission and expense lines may not be perfectly aligned across companies due to differences in reporting standards (e.g., listed players often club more items into “acquisition cost”). The “Total Outgo” row provides a more equitable basis for comparison.
An additional point of divergence is the solvency ratio. Niva Bupa reports a robust 2.03x, while Care Health’s 1.55x is marginally above the regulatory minimum of 1.5x.
Reconciling Profitability: Accounting Standards and Investment Income
Despite all three companies spending over 100% of their GWP, Star Health reported a profit of ₹815 crore and Niva Bupa ₹273 crore for the half, contrasting sharply with Care Health’s ₹192 crore loss. This disparity is primarily due to two factors:
1. Profit Measurement Against Earned Premium
While GWP represents premiums sold, profit is calculated based on premiums earned over the policy’s duration. Star Health and Niva Bupa report under the newer Ind AS accounting standards, which amortize customer acquisition costs over the policy life. Under this framework, their combined ratios (claims plus expenses relative to earned premium) are just under 100% (Star at 97.9%, Niva at 99.5%).
Care Health’s public disclosures adhere to an older format where commission expenses are recognized upfront. For H1 FY27, Care sold ₹6,193 crore in premium but could only recognize ₹3,991 crore as earned premium after reinsurance, resulting in a combined ratio of 111%.
2. The Role of Investment Income
Investment income plays a crucial role in the profitability of listed insurers:
| First half of FY27, ₹ crore | Care Health | Star Health | Niva Bupa |
|---|---|---|---|
| Underwriting result | (659) | 210 | 27 |
| Investment income | 425 | 911 | 357 |
| Profit / (loss) before tax | (255) | 1,093 | 365 |
| Profit / (loss) after tax | (192) | 815 | 273 |
The pattern reveals that Star Health and Niva Bupa generate modest profits from their core insurance underwriting activities. A significant portion, if not nearly all, of their pre-tax profits are derived from investment income. For Niva Bupa, ₹357 crore of its ₹365 crore pre-tax profit came from investments. Similarly, for Star Health, ₹911 crore of ₹1,093 crore originated from investments, including ₹229 crore in mark-to-market gains. Care Health also earns investment income, but its underwriting loss currently outweighs its investment earnings.
This suggests that listed players are not necessarily operating a fundamentally “cheaper” insurance business; rather, they achieve near break-even on underwriting and rely on their investment portfolios to deliver overall profitability.
Care’s Investment Portfolio and Income Generation
The premiums collected by an insurer are invested until claims are disbursed. As of September 30, 2026, Care Health Insurance held investments totaling ₹12,897 crore, an increase from ₹9,498 crore a year prior. Of this, ₹10,382 crore represents policyholders’ funds (up 49%), with owners’ funds remaining relatively flat at ₹2,515 crore. The growth in the investment book is therefore almost entirely attributable to customer premiums.
Care’s investment strategy is conservative: 38% of its debt holdings are in government securities, and 57% are AAA-rated, with the remaining 5% rated AA or higher. Equity investments constitute a small fraction, approximately ₹808 crore. The portfolio exhibits no significant distressed assets.
Investment income for H1 FY27 was ₹425 crore, marking a 30% increase from ₹327 crore. The annualized yield for the six-month period was approximately 7.1% (3.56% for six months), slightly lower than the 3.71% recorded in the previous year.
In comparison, Niva Bupa’s investment book stands at ₹10,488 crore, yielding approximately 7.4% annually. Star Health’s portfolio, at ₹22,491 crore, achieves an 8.5% yield, boosted by mark-to-market gains. Care’s investment engine, while larger than Niva’s and generating similar yields, is not the differentiating factor in profitability; the divergence lies primarily in underwriting performance.
Key Financial Ratios: A Holistic View
Care Health Insurance’s key reported ratios provide a consolidated view of its financial health:
| Ratio | What it tells you | H1 FY27 | H1 FY26 |
|---|---|---|---|
| Claims ratio (or loss ratio) | Net claims as a share of net earned premium | 75% | 73% |
| Expense ratio | Commission and operating costs as a share of net written premium | 36% | 35% |
| Combined ratio | Claims ratio plus expense ratio. Above 100% indicates an underwriting loss. | 111% | 109% |
| Net retention ratio | Premium kept after reinsurance | 72% | 75% |
| Investment yield (six months) | Income on the investment book | 3.56% | 3.71% |
| Solvency ratio | Capital against the regulatory requirement. Minimum is 1.5x. | 1.55x | 1.89x |
| Return on net worth (six months) | Profit on shareholders’ money | (7%) | 1% |
| Book value per share | Net worth per share | ₹26.11 | ₹26.83 |
Note: These reported ratios utilize earned premium (after reinsurance), which differs from the GWP-based percentages used in earlier tables. For instance, the claims ratio is 75% on a reported (earned premium) basis versus 65.9% on a GWP basis.
The trend indicates robust growth, yet the combined ratio has moved further into underwriting loss territory (above 100%), and the solvency ratio has declined closer to the regulatory minimum.
Valuation Perspective: Market Capitalization to GWP
For rapidly growing, younger insurers, traditional profitability metrics can be volatile due to accounting rules. Investors often use the market capitalization to GWP ratio as a simpler valuation benchmark, reflecting the price paid per unit of premium written.
As of November 18, 2026, Care Health’s unlisted shares were quoted at an indicative ₹138 on UnlistedZone, valuing the company at ₹13,873 crore.
| Care Health | Star Health | Niva Bupa | |
|---|---|---|---|
| Market cap (₹ crore) | 13,873 | 32,772 | 13,711 |
| Annualised GWP (₹ crore) | 12,386 | 19,124 | 9,268 |
| Market cap / GWP | 1.12x | 1.71x | 1.47x |
Based on today’s indicative price, Care Health is valued at approximately 1.12 times its annualized GWP (calculated by doubling H1 FY27 GWP), positioning it at a lower multiple compared to its listed peers.
Sources:
- Care Health Insurance public disclosures for the period ended September 30, 2026
- Star Health investor presentation for H1 FY27 (October 27, 2026)
- Niva Bupa investor presentation for H1 FY2027 (November 4, 2026)
- GAGA SHAREfor Care Health’s indicative price and market capitalization
Figures are in ₹ crore and rounded; therefore, totals may not add exactly.
Disclaimer:
This article is provided for informational and educational purposes only. It does not constitute investment advice or a recommendation to buy or sell any security. Unlisted shares inherently carry liquidity and valuation risks. Investors are advised to conduct their own comprehensive research or consult a registered financial adviser before making any investment decisions.
Latest Price : https://mrgaga.in/unlisted-share