

Frick India: A Deep Dive into H1 FY27 Performance – Growth Masking Core Challenges
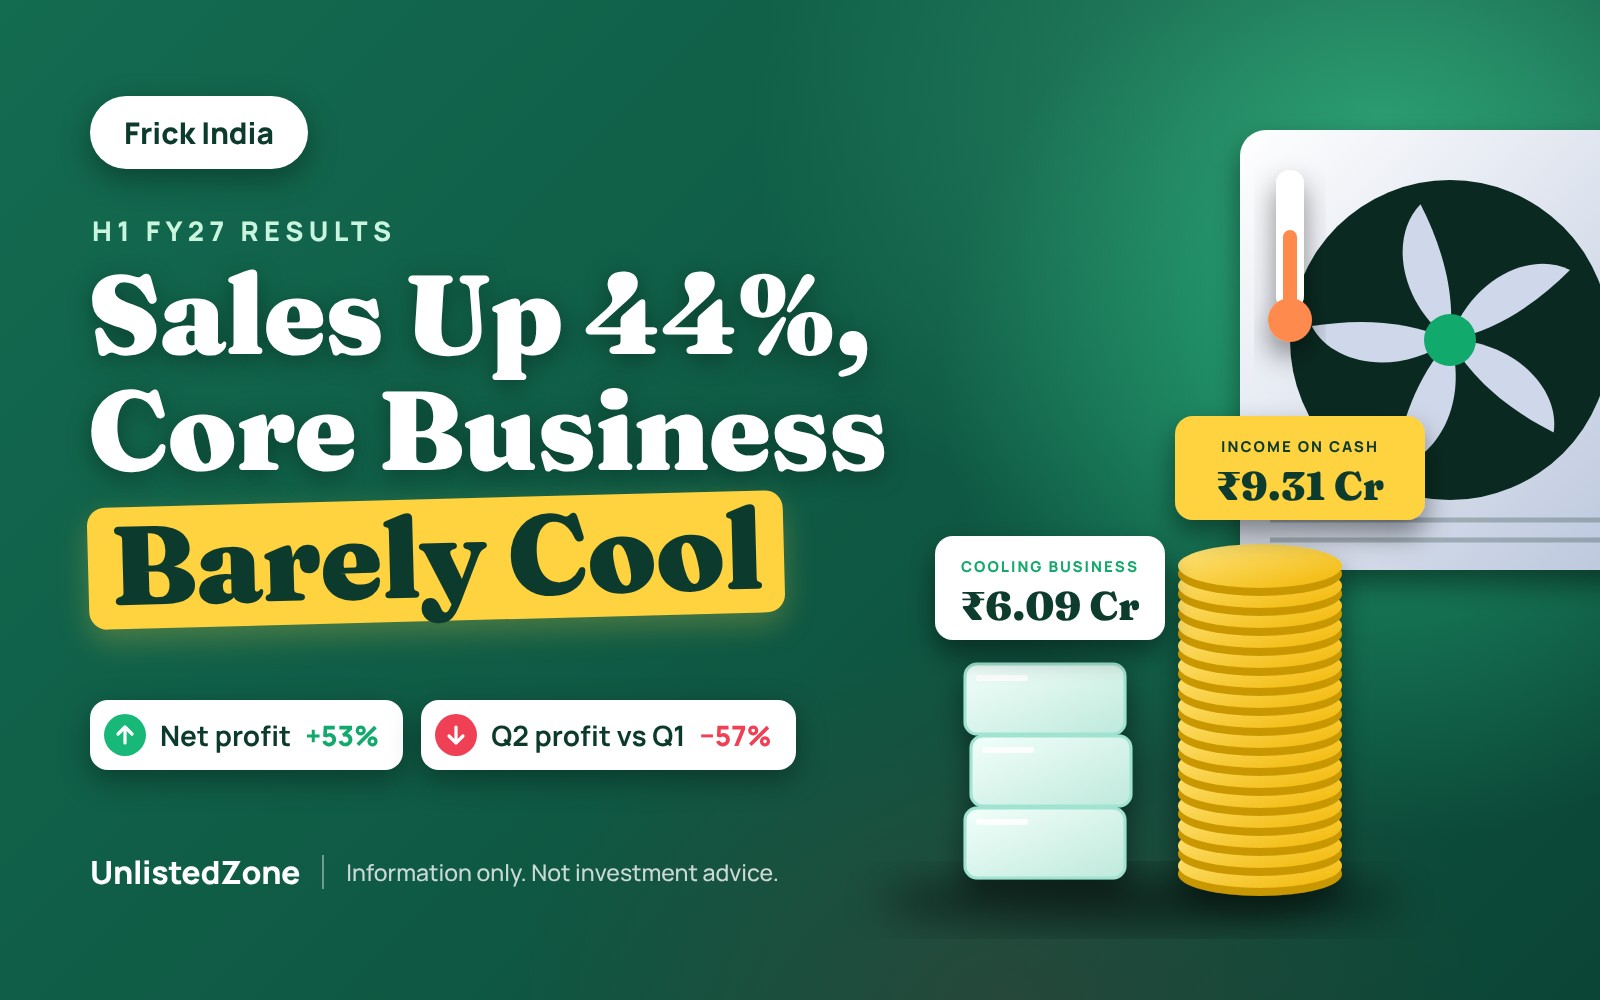
Frick India has reported an impressive first half for FY27, with sales surging by 44% to ₹252 crore and net profit increasing by 53% to ₹10.4 crore. However, a closer examination reveals that the underlying cooling business retains less than ₹4 of every ₹100 in sales, and nearly two-thirds of its pre-tax profit originates from interest on its substantial cash reserves. Furthermore, the second quarter witnessed a significant 57% decline in profit compared to Q1, suggesting a more complex operational landscape beneath the headline figures.
Company Overview: A Pillar in India’s Cold Chain
Frick India, an engineering firm based in Faridabad and established in 1962, is a pivotal yet often understated player in India’s industrial cold chain sector. The company specializes in the manufacture, supply, and execution of industrial refrigeration and air-conditioning systems. These robust cooling plants are critical for maintaining precise temperature conditions—often as low as -20°C—in large-scale facilities such as dairies, food processing units, cold storage warehouses, breweries, and pharmaceutical companies.
Frick India generates revenue through three primary channels:
| Revenue Stream | Description |
|---|---|
| Machine Manufacturing | Production of core components like compressors, chillers, and condensers at its Faridabad plant. |
| Plant Engineering & Installation | Design of comprehensive cooling systems, supply of equipment, and on-site installation at customer premises. |
| After-Sales Service | Provision of spares and maintenance services throughout the operational lifespan of the installed plants. |
The company also holds a strategic stake in Mycom-FIL India, a joint venture with a Japanese refrigeration company, an entity whose performance warrants particular attention. The nature of industrial projects—characterized by large, often lumpy orders, high material costs, and phased customer payments—is essential context for interpreting Frick India’s financial metrics.
Headline Performance: H1 FY27 Financial Scorecard
For the half-year ended September 30, 2026 (H1 FY27), Frick India demonstrated robust top-line and bottom-line growth (consolidated figures, ₹ crore):
| Item | H1 FY27 (Apr–Sep 2026) |
H1 FY26 (Apr–Sep 2025) |
Change |
|---|---|---|---|
| Revenue from Operations | 251.92 | 175.24 | +43.8% |
| Other Income | 9.31 | 6.42 | +44.9% |
| Total Expenses | 245.83 | 172.09 | +42.8% |
| Profit Before Tax | 14.49 | 9.48 | +52.8% |
| Net Profit (PAT) | 10.42 | 6.80 | +53.2% |
| EPS (₹ per share) | 17.37 | 11.34 | +53.2% |
Revenue from operations increased by approximately ₹77 crore year-on-year, with profit growth outpacing sales. Notably, employee costs rose by a modest 5% (from ₹32.3 crore to ₹33.9 crore) despite a 44% increase in revenue, indicating improved operational leverage. While these headline figures are impressive, a deeper analysis reveals several nuances.
Key Operational Insights and Challenges
1. Wafer-Thin Operating Margins
Despite the significant increase in sales, Frick India’s core operating profitability remains constrained. The proportion of revenue retained as profit is notably low:
| Out of every ₹100 of sales | H1 FY27 | H1 FY26 |
|---|---|---|
| Spent on raw materials | ₹73.8 | ₹68.1 |
| Spent on employees | ₹13.5 | ₹18.4 |
| Operating profit (EBITDA, before other income) | ₹3.8 | ₹3.7 |
| Net profit | ₹4.1 | ₹3.9 |
Escalating raw material costs are a primary factor, growing 56%—faster than the 44% sales increase. This could reflect rising commodity prices (e.g., steel) or potentially aggressive pricing strategies to secure larger orders. While significant savings in employee costs partially offset this pressure, the operating margin remained consistently below 4%. This highlights a high-volume, low-margin business model where substantial revenue throughput translates to minimal retained profit from core operations.
2. Treasury Income Driving Profitability
A critical insight emerges from the composition of Frick India’s pre-tax profit. The company maintains a substantial treasury of cash and investments, totaling approximately ₹93 crore in bank balances and fixed deposits, alongside ₹69 crore in long-term investments. Income generated from these assets—through interest, dividends, and investment gains—is categorized as “other income.”
The breakdown of H1 FY27 pre-tax profit reveals a significant reliance on this treasury income:
| Source of Pre-tax Profit (H1 FY27) | ₹ crore | Share |
|---|---|---|
| Core cooling business (operating profit after interest and depreciation) | 6.09 | 42% |
| Other income (interest, dividends, investment gains) | 9.31 | 64% |
| Loss from the joint venture | (0.92) | -6% |
| Profit before tax | 14.49 | 100% |
Notably, nearly two-thirds of the pre-tax profit originated from parked funds rather than from the direct business of building and servicing cooling plants. While a strong treasury provides a valuable financial buffer in a project-based business with lumpy cash flows, it also suggests that the core operational engine contributes a smaller proportion to overall profitability than headline figures might imply. This dependency makes the company’s profit susceptible to fluctuations in interest rates or changes in treasury deployment.
3. Q2 Underperformance: A Quarterly Deceleration
A granular examination of the quarterly performance reveals a divergence, with strong Q1 results followed by a significant slowdown in Q2:
| Item | Q1 FY27 (Apr–Jun 2026) |
Q2 FY27 (Jul–Sep 2026) |
Q2 FY26 (Jul–Sep 2025) |
|---|---|---|---|
| Revenue from Operations | 120.77 | 131.14 | 100.04 |
| Other Income | 6.07 | 3.24 | 2.14 |
| Other Expenses | 9.72 | 12.90 | 9.15 |
| Share of JV Loss | (0.30) | (0.62) | (0.09) |
| Profit Before Tax | 9.78 | 4.70 | 6.21 |
| Net Profit | 7.29 | 3.13 | 4.29 |
Despite a 9% sequential increase in sales from Q1 to Q2, and a 31% increase over Q2 FY26, net profit in Q2 FY27 plummeted by 57% quarter-on-quarter and was 27% lower than the same period last year. This decline was attributable to a confluence of factors: other income nearly halved, other expenses (including freight, site, and administrative costs) surged by approximately ₹3 crore, and losses from the joint venture doubled. These combined pressures illustrate that increased sales volume did not translate into enhanced profitability during the second quarter.
Balance Sheet Insights: Tracking Financial Health
While profit provides an insight into operational efficiency, the balance sheet offers a clearer picture of financial health and liquidity. Significant changes were observed between March 31 and September 30, 2026:
| Item | 30 Sep 2026 (₹ crore) |
31 Mar 2026 (₹ crore) |
Change | Interpretation |
|---|---|---|---|---|
| Trade Receivables | 129.15 | 85.25 | +51% | Increased customer outstanding payments. |
| Other Current Liabilities | 84.62 | 46.63 | +81% | Likely rise in customer advances, signaling new orders. |
| Loans Given | 25.26 | 0.37 | +₹24.9 cr | Significant loan extended to the JV. |
| Total Borrowings | 39.40 | 24.79 | +59% | Increase in short-term debt. |
| Bank Balances and FDs | 93.19 | 91.38 | Flat | Treasury reserves maintained. |
| Net Worth | 337.43 | 327.17 | +3% | Grew by H1 profit. |
Analysis of the balance sheet presents both positive developments and areas requiring close observation. The near-doubling of “other current liabilities” is a positive indicator, as this line item often reflects customer advances for new orders in project-based businesses, suggesting a healthy order book. Furthermore, operating cash flow turned positive at ₹8.7 crore, compared to an outflow of ₹5.7 crore in the prior year.
However, several concerns emerge: trade receivables increased by 51% in six months, outpacing sales growth. While customary for project companies with stage-based billing, this trend warrants careful monitoring. More notably, the company extended a ₹25 crore loan to its joint venture, Mycom-FIL, which reported a loss of ₹0.92 crore in H1. Concurrently, Frick India’s short-term borrowings rose by ₹14.7 crore. The decision to lend substantial capital to a loss-making JV while simultaneously increasing its own short-term debt is a strategic move that investors would likely seek clarification on from management.
Conclusion: A Balanced Outlook and Future Focus
Frick India’s H1 FY27 performance presents a dichotomy: headline growth is robust, yet the core operational efficiency and profit generation capacity require greater scrutiny.
- Strengths:
- Strong revenue (44%) and net profit (53%) growth.
- Improved operational leverage with minimal increase in employee costs.
- Positive operating cash flow.
- Rising customer advances suggest a healthy order pipeline.
- A strong balance sheet with low debt relative to net worth (₹337 crore).
- Areas for Observation:
- Persistent low operating margins (under 4%), largely impacted by rising raw material costs.
- Significant reliance on treasury income (two-thirds of pre-tax profit).
- Pronounced profit decline in Q2 FY27 (down 57% from Q1).
- Trade receivables growing faster than sales.
- A substantial ₹25 crore loan extended to a loss-making joint venture while increasing short-term borrowings.
India’s cold chain sector is poised for substantial growth, positioning Frick India advantageously. The demand landscape appears favorable. The critical question for the company moving forward is whether it can translate this increasing business into improved operating margins, reducing its dependence on treasury income to underpin overall profitability.
Key Metrics for Future Performance Tracking:
- Operating Margin: Monitor if the operating margin can consistently exceed 4%, indicating better control over material costs or improved pricing power.
- Receivables Management: Track the trend in trade receivables to ensure efficient cash conversion as projects are completed and billed.
- Joint Venture Strategy: Seek clarity on the strategic plan for the Mycom-FIL joint venture, its path to profitability, and the repayment schedule for the ₹25 crore loan.
- Quarterly Consistency: Evaluate if the Q2 slowdown was an anomaly or signals a potential trend in operational performance.
Source: Frick India Limited, unaudited standalone and consolidated financial results for the quarter and six months ended 30 September 2026, with limited review by Lodha & Co LLP, dated 13 November 2026. All figures are consolidated. This article is for informational purposes only and does not constitute investment advice.
Latest Price : https://mrgaga.in/unlisted-share