

IKF Finance Reports 33% Profit Growth to ₹86.6 Cr in H1 FY27, Margins Expand Amidst Rising Provisions
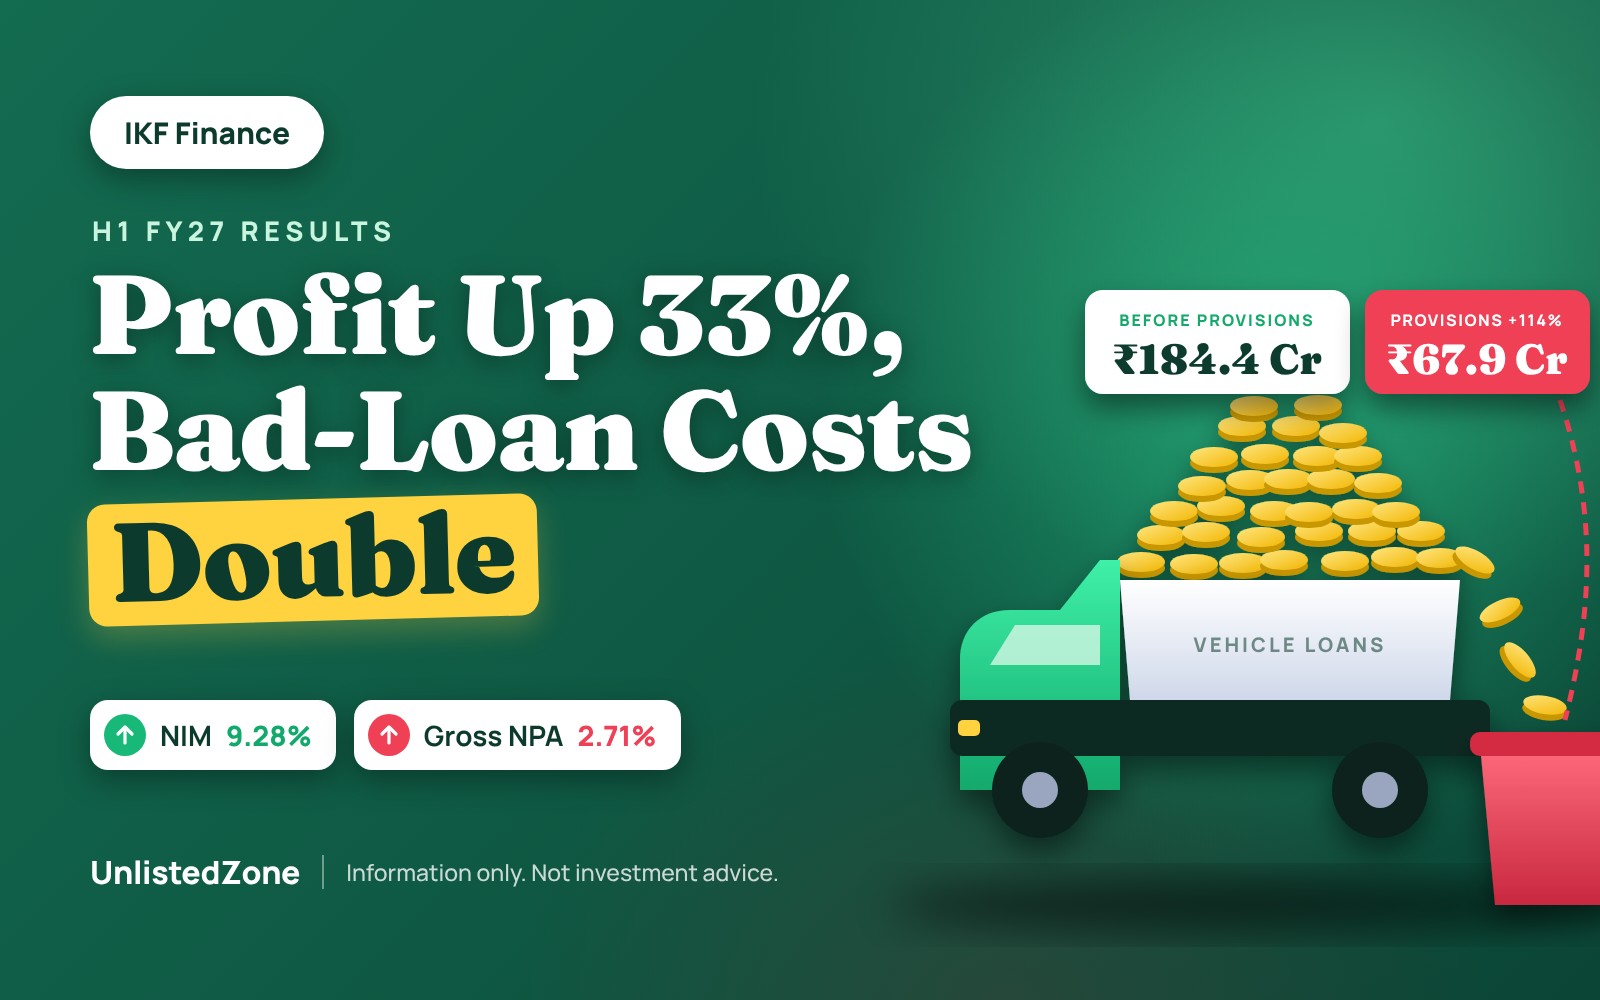
IKF Finance, a Vijayawada-based middle-layer Non-Banking Financial Company (NBFC) specializing in commercial vehicle, construction equipment, and MSME lending, delivered a robust financial performance in the first half of fiscal year 2027 (H1 FY27, April–September 2026). The company achieved a 33% increase in profit after tax, reaching ₹86.6 crore. This growth was underpinned by a substantial expansion in net interest income and margins, though significantly higher provisions emerged as a key factor to monitor.
All figures are standalone, unaudited, and in ₹ crore unless otherwise stated.
Key Financial Highlights (H1 FY27)
- Profit After Tax (PAT): ₹86.6 Cr, up 33% from ₹65.0 Cr in H1 FY26.
- Net Interest Income (NII): Increased by 50% to ₹288.4 Cr.
- Net Interest Margin (NIM): Annualized NIM widened to 9.28% from 8.15%.
- Provisions (Impairment): More than doubled to ₹67.9 Cr, growing 114%.
- Loan Book: Grew 34% year-on-year to ₹6,634 Cr.
- Gross Non-Performing Assets (GNPA): Edged up to 2.71% from 2.48%.
Performance Analysis: H1 FY27 vs H1 FY26
The company’s core earnings outpaced loan book growth, but intensified provisions moderated the overall profit increase.
| Metric | H1 FY26 | H1 FY27 | Change |
|---|---|---|---|
| Interest income | 392.9 | 539.9 | +37% |
| Fee & commission income | 3.4 | 1.1 | −68% |
| Gain/(loss) on loan assignment | 3.0 | (5.0) | n.m. |
| Fair value gains & other income | 7.5 | 10.6 | +41% |
| Total income | 406.9 | 546.6 | +34% |
| Finance cost | 200.1 | 251.5 | +26% |
| Net interest income (NII) | 192.8 | 288.4 | +50% |
| Average loan book | 4,730.1 | 6,212.1 | +31% |
| NIM (annualised) | 8.15% | 9.28% | +1.13 pts |
| Employee cost | 66.6 | 79.2 | +19% |
| Other expenses + D&A | 21.1 | 31.4 | +49% |
| Pre-provision operating profit | 119.1 | 184.4 | +55% |
| Provisions (impairment) | 31.8 | 67.9 | +114% |
| Credit cost (annualised) | 1.34% | 2.19% | +0.85 pts |
| Profit before tax | 87.4 | 116.5 | +33% |
| Tax | 22.3 | 29.8 | +34% |
| Profit after tax | 65.0 | 86.6 | +33% |
| EPS, basic (₹, not annualised) | 3.81 | 4.76 | +25% |
| Net profit margin | 15.98% | 15.85% | −0.13 pts |
| Cost-to-income | 42.4% | 37.5% | −4.9 pts |
Notes: NII = interest income less finance cost. Average loan book = average of net loans at the start and end of the half year. NIM = NII × 2 ÷ average loan book. Credit cost = provisions × 2 ÷ average loan book. Cost-to-income = operating costs ÷ (total income less finance cost). EPS is restated for the March 2026 share split (₹10 to ₹5 face value). n.m. = not meaningful.
Key Performance Drivers
- Margin Expansion: Interest income on the average loan book increased annually to 17.4% from 16.6%. Finance costs grew at a slower pace (+26%), contributing to a significant 1.13 percentage point widening of the annualized NIM to 9.28%. This was partly aided by increased equity funding following a capital raise in FY26, which reduced interest-bearing liabilities.
- Improved Cost Efficiency: Operating costs rose 26%, considerably slower than the 50% growth in NII. This led to a notable reduction in the cost-to-income ratio, which improved to 37.5% from 42.4%.
- Elevated Provisions: Impairment charges more than doubled, increasing 114% to ₹67.9 crore. Consequently, the annualized credit cost rose to 2.19% of the average loan book, up from 1.34% a year prior. This was a primary factor in profit growing slower than core operating earnings.
- Loan Assignment Loss: The company recorded a ₹5.0 crore loss from loan assignments in H1 FY27, a reversal from the ₹3.0 crore gain in H1 FY26.
- EPS Growth: Basic EPS grew 25%, lagging the 33% profit growth due to an increased share count, as shares issued in H1 FY26 were fully accounted for in the current period.
Asset Quality and Capital Profile
While the company’s loan book expanded robustly, there was a slight uptick in non-performing assets, and capital adequacy moderated.
| Metric | Sep-25 | Mar-26 | Sep-26 |
|---|---|---|---|
| Gross NPA (Gross Stage-3) | 2.48% | 2.52% | 2.71% |
| Net NPA (Net Stage-3) | 1.66% | 1.69% | 1.82% |
| Provision coverage on Stage-3 | 33.64% | 33.58% | 33.56% |
| Capital adequacy | 30.86% | 27.34% | 24.11% |
| Debt-to-equity | 2.31x | 2.50x | 2.90x |
| Total debt to total assets | 68.60% | 70.19% | 73.14% |
| Liquidity coverage ratio | 594.07% | 495.73% | 338.02% |
- NPA Trend: Gross NPA increased by 23 basis points year-on-year, reaching 2.71%, with most of this rise occurring in H1 FY27. Despite this, the NPA level remains relatively low for a vehicle and MSME financier.
- Provision Coverage: Provision coverage for Stage-3 loans remains modest at approximately 33.56%, implying that recovery on the remaining balance is heavily dependent on the underlying collateral.
- Co-lending Portfolio: The co-lending book, totaling ₹163.2 crore (including both IKF and partners’ shares), exhibits a significantly higher NPA rate of approximately 12% for IKF’s portion.
- Capital Adequacy: The capital adequacy ratio decreased from 30.9% to 24.1% over the year. While showing a decline, it comfortably exceeds the Reserve Bank of India’s (RBI) minimum requirement of 15% for NBFCs.
Balance Sheet Evolution
The company’s balance sheet reflects strong loan book expansion, primarily funded by increased borrowings.
| Metric | Sep-25 | Mar-26 | Sep-26 | YoY |
|---|---|---|---|---|
| Loans (net) | 4,946.3 | 5,790.7 | 6,633.6 | +34% |
| Investments | 649.6 | 469.2 | 707.1 | +9% |
| Cash and bank balances | 349.2 | 352.6 | 373.7 | +7% |
| Total assets | 6,064.3 | 6,757.0 | 7,855.5 | +30% |
| Debt securities (NCDs) | 803.6 | 945.8 | 1,281.3 | +59% |
| Bank and other borrowings | 3,192.4 | 3,632.4 | 4,324.7 | +35% |
| Subordinated debt | 164.2 | 164.4 | 139.4 | −15% |
| Total borrowings | 4,160.2 | 4,742.6 | 5,745.4 | +38% |
| Net worth | 1,798.8 | 1,895.6 | 1,984.2 | +10% |
- Loan Growth: The net loan book expanded by 34% year-on-year, reaching ₹6,634 crore.
- Funding Mix: Total borrowings surged 38% year-on-year to ₹5,745.4 crore, outpacing the 10% growth in net worth. Notably, NCDs increased by 59%, now comprising 22% of total borrowings, up from 19% a year ago, indicating a shift towards market-based funding.
- Equity Growth: Share capital remained unchanged, implying net worth growth was solely driven by retained earnings.
- Liquidity Position: With cash, bank balances, and investments totaling approximately ₹1,081 crore, the company maintains a comfortable liquidity buffer.
Outlook and Key Considerations
IKF Finance demonstrates strong core earnings growth; however, credit costs and capital management will be critical determinants of future performance.
- Provisioning Trajectory: The significant increase in H1 FY27 credit cost (2.19% vs 1.34% in H1 FY26) suggests that the rate of future provisions will heavily influence full-year profitability.
- NIM Sustainability: The current NIM benefits partly from a higher equity base (post-FY26 capital raise). As the debt-to-equity ratio continues to climb (2.90x from 2.31x), there is potential for NIM to compress.
- NPA Development: The 19 basis point rise in Gross NPA during H1 FY27 warrants close monitoring. A sustained increase, particularly above the 3% threshold, would signal a potential deterioration in asset quality.
- Assignment Income Volatility: The swing from a gain to a loss in loan assignment income highlights its potential to significantly impact short-term profitability.
- Capital Needs: Given the 34% annual loan book growth and the declining capital adequacy (24.1%), sustained growth at this pace may necessitate a fresh equity infusion in the future.
- New Leadership: Debnil Chakravarty has been appointed Chief Executive Officer for a five-year term, effective November 3, 2026. His extensive experience across prominent financial institutions (ICICI, Citi, SREI, South Indian Bank) positions him to steer the company’s strategic direction.
Source: IKF Finance Ltd, unaudited standalone results for the quarter and half year ended 30 September 2026, filed with BSE on 3 November 2026 (limited review by Mukund M. Chitale & Co., unmodified opinion); and IKF Finance Ltd, unaudited standalone results for the half year ended 30 September 2025, filed with BSE on 7 November 2025 (Mar-25 and Sep-25 balance sheet figures). Figures converted from ₹ lakh to ₹ crore; NII, average loan book, NIM, credit cost, operating profit and cost-to-income are GAGA SHAREcalculations.
Disclaimer: This article is for informational purposes only and is not investment advice, nor an offer to buy or sell any security. Unlisted share prices are indicative. Please conduct your own research or consult a SEBI-registered advisor before making any investment decisions.
Latest Price : https://mrgaga.in/unlisted-share