

Analysis of INOX Air Products’ Initial Public Offering
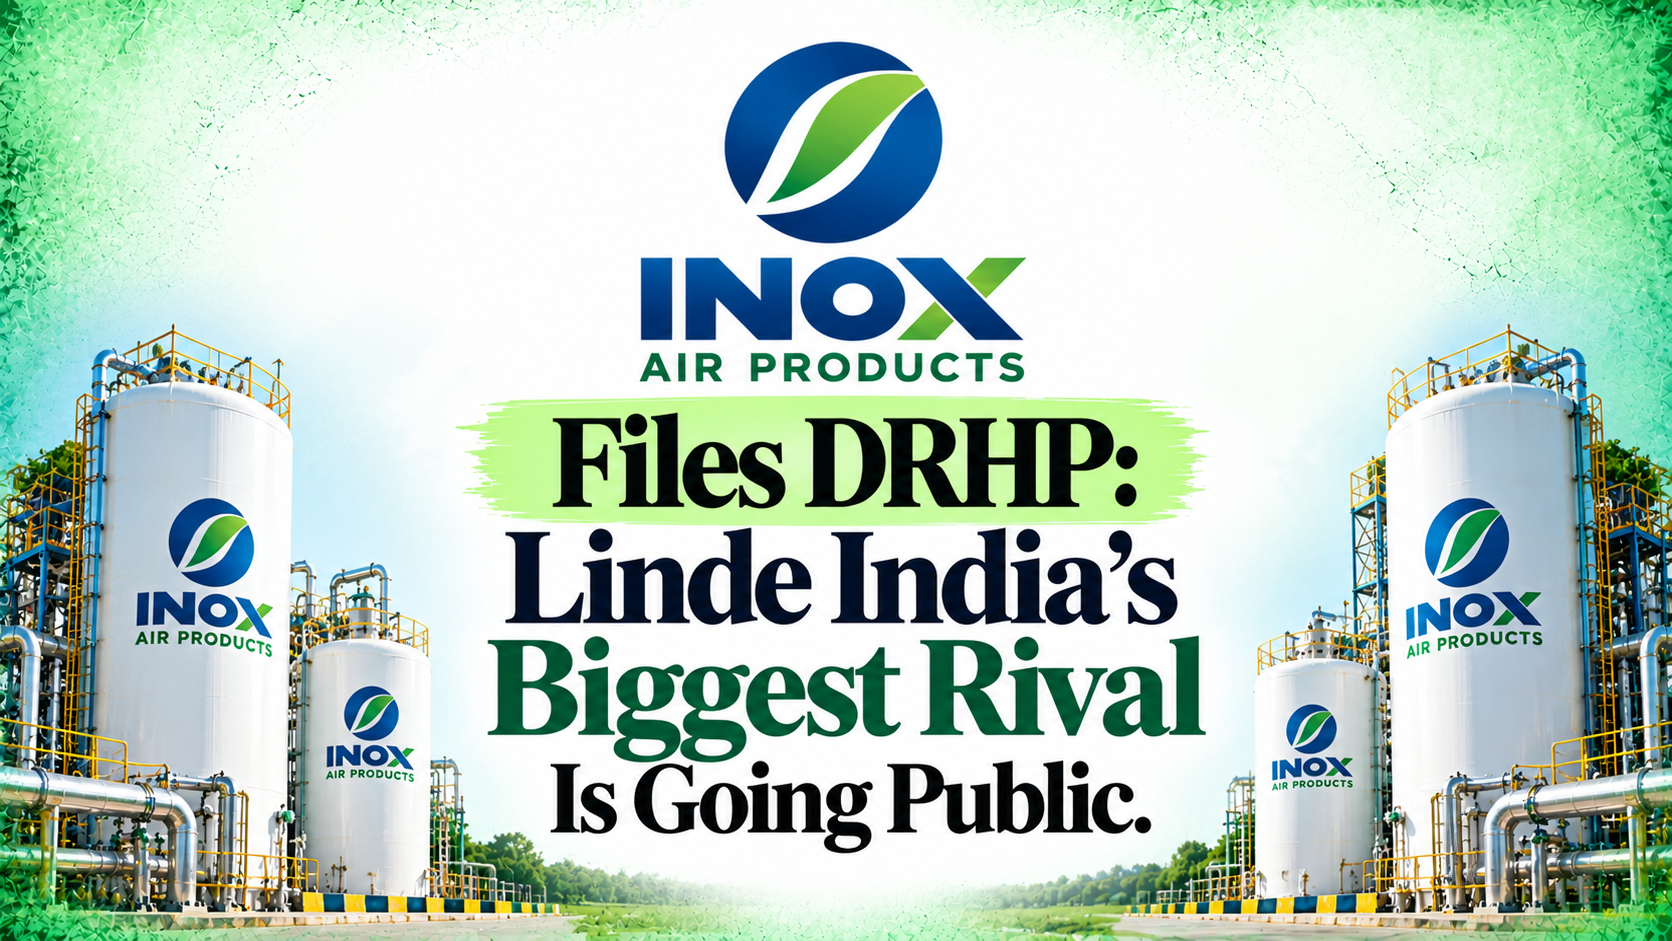
INOX Air Products, a 50:50 joint venture between America’s Air Products and the INOX Group, has filed its Draft Red Herring Prospectus (DRHP) for a 100% Offer for Sale (OFS) of 7.72 crore shares. As India’s largest industrial gas company prepares to enter the public market, our initial valuation assessment suggests a fair price band of approximately ₹1,050–₹1,100 per share. This valuation would imply a market capitalization of around ₹55,000 crore, translating to roughly 60 times its last fiscal year’s earnings. This analysis delves into INOX Air Products’ revenue generation across on-site, merchant, and cylinder gases, compares its FY26 performance with industry peers Linde India and Ellenbarrie, and details the basis for our projected price band.
Company Genesis and Evolution
Founded in 1963 as Industrial Oxygen Company, the enterprise began with a single compressed oxygen plant in Pune under the Jain family, also proprietors of the INOX Group. A pivotal moment occurred in 1999 when Air Products and Chemicals, one of the world’s leading industrial gas companies, acquired a 50% stake through its unit, Prodair Corporation, leading to the company’s rebranding as INOX Air Products. The company had a brief listing on regional stock exchanges before being delisted around 1999–2000.
Today, INOX Air Products operates as a near-perfect 50:50 joint venture, with Prodair owning 49.74% and Jain family entities holding the remainder. Siddharth Jain serves as the Managing Director.
Current Operational Scale (FY26)
- 57 operating locations across 15 states and one union territory.
- 739 cryogenic tankers, representing India’s largest fleet, covering 39 million km last year.
- Approximately 1,800 employees serving over 3,000 customers.
- ₹3,034 crore in revenue, making it India’s largest industrial gas company by revenue, surpassing Linde India.
Business Model: Monetizing Air
The core of INOX Air Products’ business lies in separating atmospheric air, which consists of 78% nitrogen, 21% oxygen, and 1% argon. Air separation units (ASUs) chill air to approximately −180°C to liquefy and separate these gases. While air is free, electricity constitutes the primary operational cost, consuming about 22% of INOX’s revenue.
Key Customer Segments
Demand for industrial gases is broad-based:
- Steel mills: Require oxygen for steel production.
- Healthcare: Medical oxygen for hospitals.
- Pharmaceutical and glass manufacturers: Nitrogen for various processes.
- Solar and semiconductor industries: Ultra-pure gases for manufacturing.
Steel, healthcare/pharma, and automotive sectors collectively account for 57% of INOX Air Products’ revenue.
Supply Modalities and Revenue Contribution
INOX Air Products employs three distinct supply methods, each with unique contractual structures and strategic implications:
| Way of Supply | Share of FY26 Revenue | Mechanism | Contractual Terms |
|---|---|---|---|
| Merchant (bulk liquid) | 58.6% | Liquid gas is transported by truck to storage tanks owned by INOX at customer sites. | Mix of long-term contracts and purchase orders. Economic radius for liquid gas delivery is ~300 km. |
| On-site | 28.7% | INOX constructs and operates an air separation unit within the customer’s factory, piping gas directly. | 15–20 year “take-or-pay” contracts, where the customer pays for a minimum quantity regardless of consumption. Customer typically provides power. |
| Packaged & Specialty | 12.8% | Gas supplied in cylinders for hospitals and small users, alongside ultra-high-purity gases for advanced industries (e.g., semiconductors, solar cells). | Primarily purchase orders. Represents a high-value, future-oriented segment. |
On-site contracts provide stability, akin to utility services, with long-term, non-cancellable agreements. Merchant sales are a key profit driver, leveraging INOX’s extensive plant network and tanker fleet. A strategic advantage involves INOX purchasing surplus gas from its on-site plants, which often produce more than required by the host steel mill, and redistributing it through its merchant network, effectively utilizing capacity partially funded by the host customer.
Initial Public Offering Details
The DRHP was filed on September 30, 2026, with Kotak, Citi, ICICI Securities, and J.P. Morgan serving as lead managers. This IPO is structured as a 100% Offer for Sale (OFS), meaning no new shares will be issued by the company. All proceeds from the sale of up to 7.72 crore shares will accrue directly to the existing selling shareholders, not to INOX Air Products.
Selling Shareholders and Shareholding Implications
The OFS maintains the existing 50:50 joint venture balance post-listing, with both partners selling an almost equal number of shares:
| Seller | Associated Entity | Shares Offered | Average Cost Per Share (₹) |
|---|---|---|---|
| Prodair Corporation | Air Products | 3,85,78,328 | 7.49 |
| Siddhomal Air Products | Jain Family | 1,46,73,000 | 0.06 |
| INOX Chemicals LLP | Jain Family | 1,17,65,280 | 0.64 |
| Siddho Mal Trading LLP | Jain Family | 1,16,49,450 | 0.26 |
| Sitashri Trading and Finance | Jain Family | 4,90,605 | 3.22 |
Post-IPO, both Air Products and the Jain family will each retain approximately 42% ownership. The company currently holds approximately ₹850 crore in net cash, indicating no immediate need for fresh capital. The primary motivations for the OFS are likely to provide an exit route for long-term owners, establish a market valuation for the 60-year-old business, and create publicly traded shares for future flexibility.
A notable point is that public shareholding will initially be around 16%. SEBI regulations mandate listed companies to achieve 25% public holding over time, implying that promoters will likely sell additional shares in the years following the listing, which could potentially impact share price dynamics.
Financial Performance (Restated Consolidated Figures from DRHP)
INOX Air Products demonstrates consistent revenue growth, robust operating margins, and a strategy of reinvesting nearly all generated capital into new infrastructure.
| Metric (₹ crore) | FY24 | FY25 | FY26 |
|---|---|---|---|
| Revenue from operations | 2,590 | 2,790 | 3,034 |
| Revenue growth | 18.2% | 7.7% | 8.8% |
| Operating EBITDA (excl. other income) | 1,146 | 1,259 | 1,421 |
| Operating EBITDA margin | 44.3% | 45.1% | 46.8% |
| Other income | 184 | 259 | 179 |
| Depreciation | 231 | 264 | 346 |
| Profit after tax (PAT) | 766 | 881 | 914 |
| EPS (₹, on 51.7 crore post-bonus shares) | 14.8 | 17.0 | 17.7 |
| Operating cash flow | 894 | 861 | 1,264 |
| Capex (net of subsidies) | 1,013 | 1,261 | 1,110 |
| Free cash flow | –120 | –399 | 155 |
Note: Operating EBITDA is calculated excluding other income and joint-venture profit, differing from the company’s reported EBITDA of ₹1,648 crore for FY26.
Balance Sheet Snapshot (as of March 2026)
- Net worth: ₹7,269 crore (₹140.41 per share).
- Gross debt: ₹1,366 crore.
- Treasury (mutual funds, deposits, cash): Approximately ₹2,200 crore.
- Net cash: Approximately ₹850 crore.
- Capital Work-in-Progress (CWIP): ₹1,415 crore, representing about one-fifth of the asset base, not yet revenue-generating.
Note on Share Count: Prior to the IPO, each ₹10 share was split into ten ₹1 shares, followed by a 4:1 bonus issue. This resulted in a 50-fold increase in share count, impacting EPS reporting from prior annual reports (e.g., ₹885 to ₹17.68 for the same profit).
Strengths and Competitive Advantages
- Market Leadership: INOX Air Products holds a 22.4% share of India’s industrial gas market, with 31.0% in the merchant segment and 17.8% in on-site. It commands significant market shares in specific sectors, such as 40.1% in glass and 35.5% in metals.
- Superior Margins: The company consistently outperforms listed peers in operating EBITDA margins.
- Contracted Revenue Stability: On-site contracts span 15–20 years with “take-or-pay” clauses, ensuring predictable revenue streams. The company has approximately ₹3,619 crore of contracted revenue yet to be recognized, in addition to plant lease rentals.
- Robust Balance Sheet: Characterized by net cash, an AA+ credit rating, and strong operating cash flow generation (₹1,264 crore in FY26).
- Significant Capacity Expansion: 4,314 tonnes per day (TPD) of new on-site capacity, including two 1,800 TPD plants for Tata Steel in Odisha, is under construction. An additional 921 TPD of merchant capacity is being added, alongside plans for a specialty gas hub at Dholera, Gujarat, targeting semiconductor and solar industries.
Peer Comparison (FY26 Figures, as of September 29, 2026)
| Metric | INOX Air Products | Linde India | Ellenbarrie |
|---|---|---|---|
| Revenue (₹ cr) | 3,034 | 2,531 | 342 |
| Revenue growth | 8.8% | 1.8% | 9.3% |
| Operating EBITDA margin (excl. other income) | 46.8% | 35.9% | 34.2% |
| Profit after tax (₹ cr) | 914 | 551 | 104 |
| Operating cash flow (₹ cr) | 1,264 | 786 | 133 |
| Free cash flow (₹ cr) | 155 | 25 | –25 |
| ROE | 13.4% | 13.7% | 12.9% |
| ROCE | 15.6% | 18.2% | 14.5% |
| Tankers owned | 739 | 180–200 | 70–90 |
| P/E (FY26 profit) | IPO pending | 95.9x | 50.0x |
Source: Peer figures are standalone from Screener. INOX’s ROE and ROCE are calculated for fair comparison. INOX’s free cash flow is net of ₹52 crore in capital subsidies. Note that Linde India’s revenue includes low-margin plant construction contracts, which contributed ₹768 crore in FY24 and ₹445 crore in FY25, influencing its revenue growth profile.
Key Risks and Considerations
- Flattered Profit Growth: FY26 profit includes a ₹47 crore payment from Bellary Oxygen, a joint venture with no active business since November 2021, effectively a one-time gain. Additionally, other income decreased by ₹80 crore. Excluding these, core pre-tax profit growth was approximately 9%, from ₹895 crore to ₹978 crore.
- Modest Revenue Growth: Revenue grew 7.7% in FY25 and 8.8% in FY26. Such growth rates typically warrant lower earnings multiples than the 60x+ often paid for companies with 20%+ growth. Sustaining a high multiple will depend on the performance of new plants.
- Limited Free Cash Flow: Cumulative free cash flow over FY24–26 was approximately –₹364 crore, indicating significant reinvestment into plants, partially funded by ₹1,500 crore in new loans. Dividend payout is minimal, at about 2% of profit.
- Declining Returns on Capital: Adjusted Return on Capital Employed (ROCE) decreased from 30.2% in FY24 to 24.5% in FY26. Return on Net Worth stands at 12.6%, partly due to ₹2,200 crore held in treasury. Based on a simpler Screener formula, INOX’s ROCE of 15.6% is below Linde India’s 18.2%.
- Rising Customer Concentration: The top 5 customers accounted for 25.9% of FY26 revenue, up from 21.5% a year prior. One unnamed customer contributes approximately 12%. On-site plants are dedicated to single customers, making them susceptible to slowdowns in client operations.
- Dependence on Cyclical Sectors: Steel, healthcare/pharma, and auto sectors collectively represent 57% of revenue. A downturn in the steel industry, for example, could negatively impact both on-site volumes and merchant demand.
- Related Party Disclosure: Based on a legal opinion, Gujarat Fluorochemicals and GFCL EV Products, INOX Group companies, are no longer treated as related parties, retrospectively applied to October 2021. This means transactions with these entities are not disclosed as related-party dealings.
- Future Share Supply: With public shareholding expected to be around 16% post-listing, promoters will need to offload more shares over time to meet the 25% SEBI mandate, potentially creating additional supply in the market.
Valuation Estimate and Price Band
Our assessment indicates an expected price band of approximately ₹1,050–₹1,100 per share. This translates to a market capitalization of ₹54,300–₹56,900 crore, a P/E ratio of 59–62x, and an OFS size of ₹8,100–₹8,500 crore. This is an independent estimate; the official price band will be announced closer to the IPO opening.
Valuation Methodology
- Earnings Selection: FY26 EPS is ₹17.68 based on 51.70 crore post-bonus shares. After adjusting for the one-time ₹47 crore JV payout, core EPS is approximately ₹16.76. While bankers may price off the reported ₹17.68, the lower core figure should be considered.
- Peer Multiple Analysis:
Peer Share Price Market Cap (₹ cr) FY26 Profit (₹ cr) P/E FY26 Operating EBITDA (₹ cr) Market Cap ÷ Operating EBITDA Price to Book Linde India ₹6,200 52,855 551 95.9x 909 58.1x 12.5x Ellenbarrie ₹369 5,205 104 50.0x 117 44.5x 5.3x Average 73.0x 51.3x 8.9x Source: Screener (Linde India, Ellenbarrie), standalone figures. P/E = market cap ÷ FY26 profit. Operating EBITDA excludes other income, consistent with INOX’s calculation.
- IPO Discount Application: Large OFS IPOs typically incorporate a 15–20% discount to listed peer valuations to attract new investors. Applying this discount to the average peer P/E of 73x yields a P/E range of approximately 58–62x.
- Share Price Derivation: Price = EPS × P/E = ₹17.68 × (58 to 62) ≈ ₹1,025 to ₹1,096 per share.
- Cross-Verification:
- EBITDA Multiple: INOX’s operating EBITDA is ₹1,421 crore. Peers trade at 44.5–58.1x (average 51x). Applying a 20–25% discount (38–40x) results in a market capitalization of ₹54,000–₹56,800 crore, or ₹1,045–₹1,100 per share.
- Deal Size: Reuters reported an IPO size of around $1 billion in March. Our estimated price band implies an OFS size of ₹8,100–₹8,500 crore (≈$0.9–1.0 billion, assuming ₹88/USD).
- Price to Book: At ₹1,075, the stock would trade at approximately 7.7x its book value of ₹140.41, positioning it between Ellenbarrie’s 5.3x and Linde India’s 12.5x.
These cross-checks align broadly, reinforcing confidence in the estimated range.
Valuation Scenarios
| Scenario | P/E | Price Per Share (₹) | Market Cap (₹ cr) | OFS Size (₹ cr) |
|---|---|---|---|---|
| Conservative | 52x | ~919 | ~47,500 | ~7,090 |
| Base Case | 60x | ~1,061 | ~54,900 | ~8,190 |
| Aggressive | 68x | ~1,202 | ~62,100 | ~9,270 |
Potential factors that could push the price higher include strong investor demand for large IPOs or aggressive anchoring closer to Linde India’s higher P/E multiple. Conversely, weak market sentiment or investor focus on the 9% core growth and limited free cash flow could exert downward pressure.
Insights for Pre-IPO Investors
Analyzing the INOX Air Products DRHP offers several valuable lessons for investors evaluating unlisted or pre-IPO opportunities:
- Verify Pre-IPO Price Authenticity: The DRHP confirms no shares were issued or traded by promoters in the last three years, excluding bonus issues, indicating no recent funding rounds or authentic pre-IPO prices. Always consult the DRHP section “Price per share based on last five primary or secondary transactions” before trusting any unlisted quotes, which can sometimes be based on outdated book values.
- Adjust for Corporate Actions: Account for stock splits and bonus issues. A pre-split unlisted price must be adjusted by a factor of 50 (for INOX) to accurately compare with the IPO price.
- Understand Fund Allocation: Distinguish between fresh issues, where capital flows to the company for growth, and Offers for Sale (OFS), where proceeds go to existing shareholders. INOX’s 100% OFS means the IPO itself does not directly fuel company growth.
- Assess Seller’s Cost Basis: Review the “weighted average cost of acquisition” for selling shareholders. A significant disparity between original cost (e.g., ₹0.06–₹7.49 for INOX sellers) and the IPO price is normal for long-term investments but warrants scrutiny for more recent pre-IPO funding rounds.
- Deconstruct Headline Financials: Examine the definitions behind reported numbers. INOX’s reported “EBITDA margin” of 51% (FY26) includes other income and is based on total income; its true operating EBITDA margin is closer to 47%, still excellent, but a distinction to note.
- Identify One-Offs: Scrutinize financial notes for non-recurring gains, such as the ₹47 crore JV payout in FY26, which can distort core profit growth.
- Prioritize Cash Flow over Profit: While ₹914 crore in profit is strong, near-zero cumulative free cash flow over three years signals a high-reinvestment business. Future returns are contingent on the successful commissioning of ₹1,415 crore worth of unfinished plants.
- Be Aware of Lock-in Periods: SEBI regulations typically impose a six-month lock-in period for pre-IPO shares held by non-promoter entities, meaning they cannot be sold immediately on listing day.
Conclusion
INOX Air Products presents as a high-quality, market-leading enterprise distinguished by utility-like contracts and strong operating margins. The central question for investors is whether its core growth rate of approximately 9% and constrained free cash flow justify a valuation around 60 times earnings. The investment thesis largely hinges on the anticipated returns from its substantial new capacity additions and its strategic foray into high-value electronic gases.
Disclaimer: This article is intended for educational purposes only and does not constitute investment advice. The price band presented is an independent estimate based on publicly available data and assumptions. The official price band and final prospectus may contain different information. Investors should consult a SEBI-registered financial advisor before making any investment decisions.
Sources:
- INOX Air Products DRHP dated September 30, 2026: Financials, Key Performance Indicators (KPIs), Offer Structure, Peer Revenue Mix, Upcoming Capacity (“Our Business”).
- INOX Air Products Annual Report FY2025-26: Contracted Revenue Still to be Recognised (Note 28), Credit Rating, Projects Under Implementation (Board’s Report).
- Screener, FY26 figures and September 29, 2026 prices: Linde India, Ellenbarrie.
Latest Price : https://mrgaga.in/unlisted-share